This article compares PSA vs Membrane Nitrogen Generators on purity, kWh per Nm3, and total cost under realistic plant conditions.Executive overview. This technical note benchmarks PSA vs Membrane Nitrogen Generators on three decision drivers: delivered purity at the point of use, kWh per Nm³ of nitrogen under realistic compressor conditions, and total cost across the asset life. All figures below are engineering ranges that can be tuned with vendor data and site measurements. For US readers, quick references are included for SCFH/psi and °F where relevant; tables concentrate the key numbers so you can drop them straight into a spec or internal memo.
1) What changes between PSA and membrane in real plants
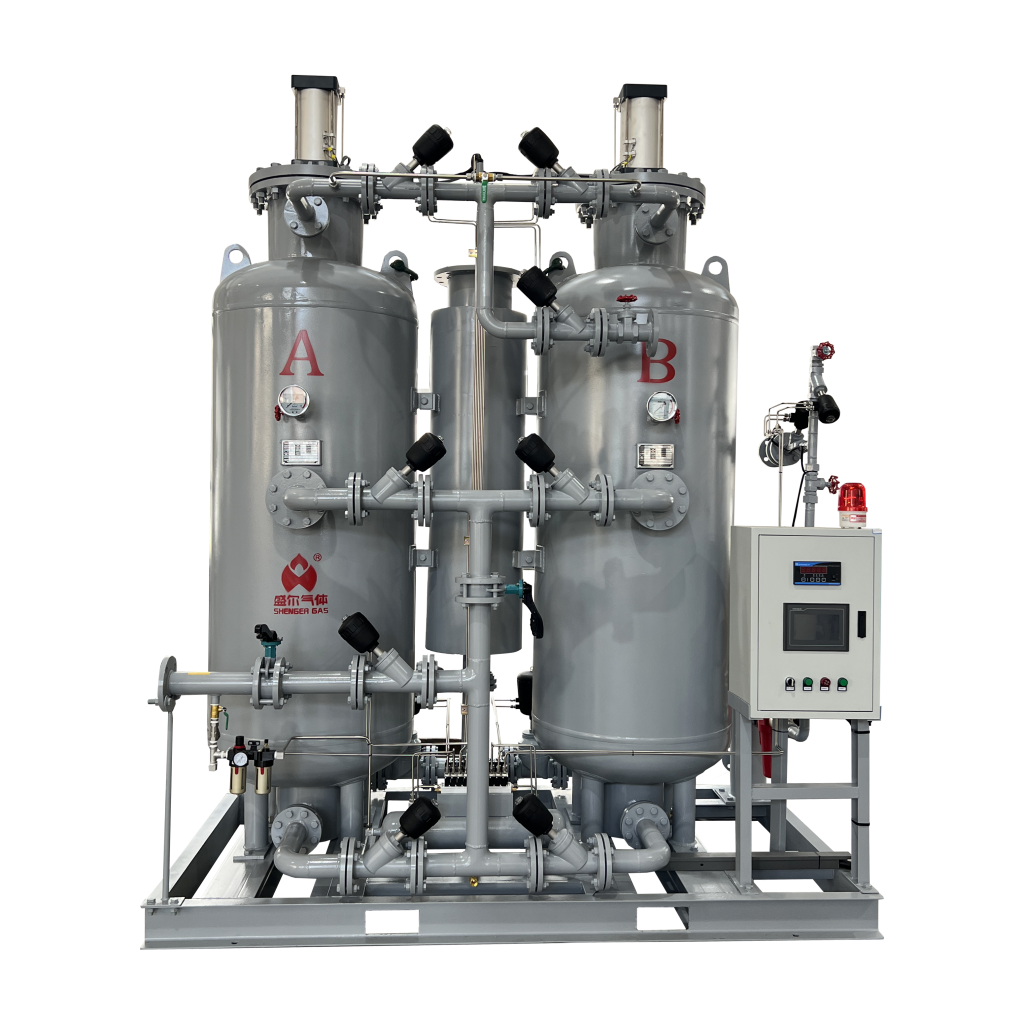
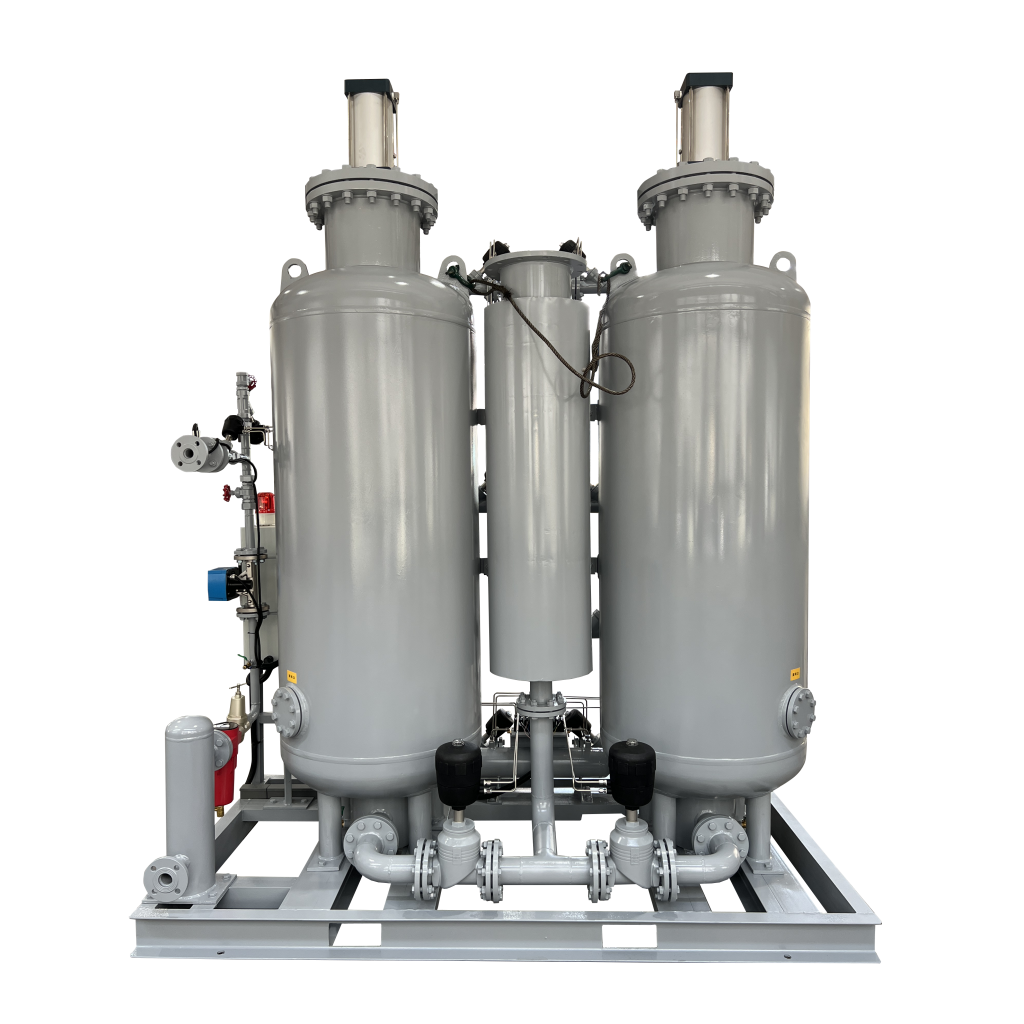
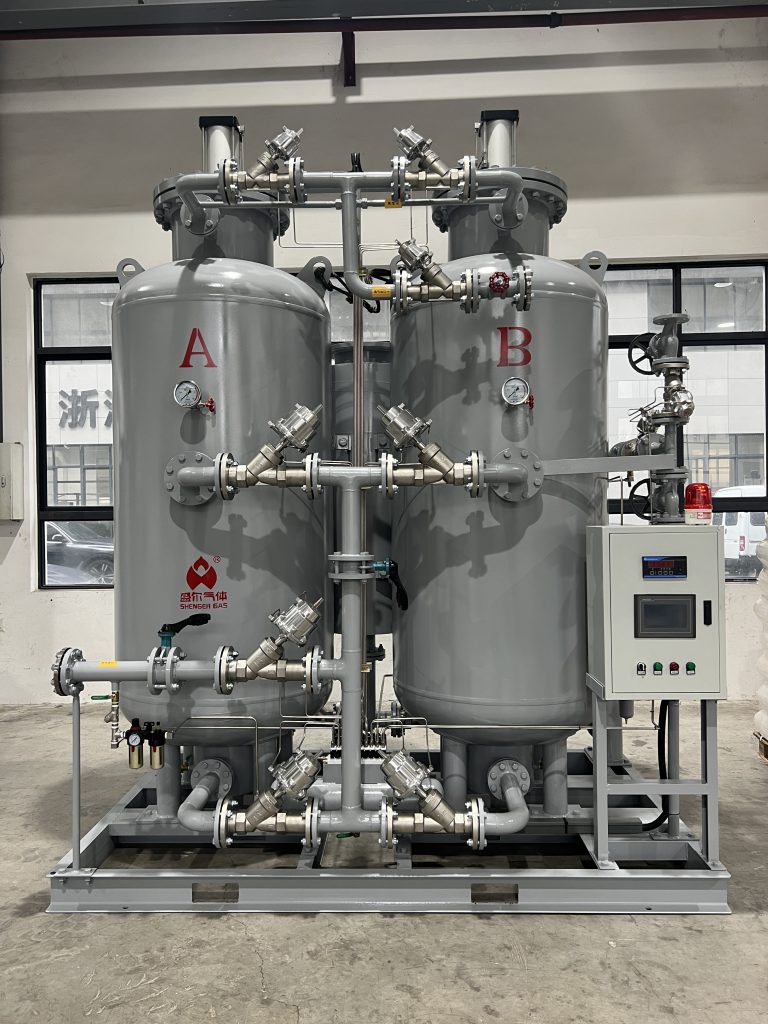
Both technologies begin with clean, dry compressed air and end with nitrogen buffered into a header. The difference sits inside the separation core and shows up in purity ceilings, air demand, and dynamics. PSA uses carbon molecular sieve beds cycling between high and low pressure, which supports very high purity but requires more hardware volume, more valves, and careful purge control. Membrane packages rely on polymeric hollow fibers; fast gases permeate and are vented, while the slow component—nitrogen—stays on the retentate side as product. That architecture is extremely compact and quick to start but runs out of headroom when chasing ultra-high purity or very large flows.
From an operations perspective, maintenance emphasis also diverges. PSA needs valve integrity, analyzer calibration, and protection of the sieve from oil and water. Membranes demand continuous control of oil/hydrocarbon carryover and pressure/temperature limits to preserve fiber performance. These differences matter when you translate PSA vs Membrane Nitrogen Generators into lifecycle modeling and service contracts.
2) Purity boundaries and usable operating envelope
The first filter in any selection is the purity band genuinely required by the process. The tables below summarize what single-stage systems typically deliver, and where staging or alternative routes become necessary. Treat them as starting points for vendor-backed sizing.
Table 1 — Practical capability envelope (single-stage, typical industrial packages)
| Metric | PSA nitrogen generator | Membrane nitrogen generator | Notes |
|---|---|---|---|
| Practical product purity (vol%) | 99.0–99.999 (5N) | 95.0–99.5 | Membranes at ≥99.0% often accept lower flow or multi-stage |
| Purity stability | High (with proper buffering) | Moderate at high turndown | Analyzer + buffer design is decisive for both |
| Start-up to spec | Minutes to hours | Seconds to minutes | Membranes excel for frequent starts |
| Typical dew-point strategy | −40 °C PDP baseline; −60 °C when required | Same as PSA | Dryer choice drives purge and auxiliary energy |
| Footprint & weight | Larger skid; twin towers + CMS | Very compact | Relevant for brownfield fit-ups |
3) Energy and air consumption ranges without formulas
Energy is dominated by the compressor. Rather than equations, the next table provides air-per-nitrogen and unit-energy ranges that reflect recovery or stage-cut behavior at different purities. Use these to bracket feasibility during early screening.
Table 2 — Air demand and unit energy by target purity (single-stage unless noted)
| Target purity (vol%) | PSA: Air per N₂ (Nm³ air / Nm³ N₂) | PSA: Unit energy (kWh/Nm³) | Membrane: Air per N₂ (Nm³ air / Nm³ N₂) | Membrane: Unit energy (kWh/Nm³) | Comments |
|---|---|---|---|---|---|
| 95% | — | — | 1.4–1.7 | 0.30–0.45 | Membrane sweet spot for inerting/blanketing |
| 98% | — | — | 1.6–2.0 | 0.35–0.50 | Often single-stage membrane winner |
| 99% | 2.2–2.8 | 0.45–0.60 | 2.0–3.2 | 0.60–0.85 | Compare both; compressor curves decide |
| 99.5% | 3.0–4.0 | 0.60–0.85 | 2.5–5.0* | 0.75–1.10* | *Membrane values assume staging or flow trade-offs |
| 99.999% (5N) | 5.7–7.1 | 1.10–1.50 | — | — | Non-cryogenic ceiling is PSA |
Ranges assume well-sized pre-treatment with −40 °C PDP baseline and typical purge for desiccant dryers. Hot climates, high intake temperatures, or aggressive piping pressure drops push the upper end.
4) Cost structure: where money actually goes
Electricity typically contributes the majority of OPEX. CAPEX splits differently because the “core separation” block is either towers with CMS or membrane bundles. The share numbers below are representative of medium-size industrial systems and help you communicate trade-offs to procurement.
Table 3 — Indicative CAPEX split by subsystem
| Subsystem | PSA share (%) | Membrane share (%) | Cost drivers |
|---|---|---|---|
| Air compressor & drives | 35–45 | 35–45 | Specific energy, inlet temperature, VFD strategy |
| Separation core (towers + CMS vs. membrane area) | 20–30 | 25–35 | CMS mass & vessel size vs. membrane selectivity/area |
| Pre-treatment (filters, dryer, cooler) | 8–15 | 8–15 | Oil/water removal protects the core |
| Controls & analyzers | 8–12 | 8–12 | Purity, dew point, pressure/flow interlocks |
| Piping/skid/buffers | 8–12 | 6–10 | ΔP management, noise, accessibility |
| Installation/commissioning | 5–10 | 4–8 | Utilities tie-ins, FAT/SAT scope |
For OPEX, expect electricity to cover 70–85% of annual spend for steady duty, with maintenance dominated by valves/CMS on PSA and filter/membrane care on membrane systems. These patterns are useful when building a total cost narrative for PSA vs. Membrane Nitrogen Generators in management reviews.
5) Worked comparison as tables (no equations)
To keep things practical, the following cases hold site conditions constant and present the outcome strictly as numbers. You can copy the structure into a plant-specific sheet and replace the values with vendor data.
Assumptions used for all cases: 300 Nm³/h nitrogen, continuous 8,000 h/year, electricity 0.10 $/kWh, product pressure matched by the same compressor class, −40 °C PDP baseline. Auxiliary energy and dryer purge reflected in the unit-energy ranges.
Table 4 — Case comparison at equal flow (screening quality)
| Case | Technology & purity | Air per N₂ (Nm³/Nm³) | Unit energy (kWh/Nm³) | Annual electricity (kWh) | Annual electricity ($) | Notes |
|---|---|---|---|---|---|---|
| A | PSA @ 99.0% | 2.2–2.8 | 0.45–0.60 | 1.08–1.44 M | 108k–144k | Stable purity; larger skid |
| B | Membrane @ 98.0% | 1.6–2.0 | 0.35–0.50 | 0.84–1.20 M | 84k–120k | Compact; very fast start-up |
| C | Membrane @ 99.0% | 2.0–3.2 | 0.60–0.85 | 1.44–2.04 M | 144k–204k | Often needs staging or higher feed pressure |
The crossover is clear: at moderate purity, membranes save energy and footprint; at 99% and above, PSA becomes competitive or superior on kWh per Nm³, especially for stable 24/7 duty.
Table 5 — TCO components (screening quality; medium size packages)
| Component | PSA (typical) | Membrane (typical) | Comment |
|---|---|---|---|
| Electricity share of OPEX | 70–85% | 70–85% | Compressor dominates both |
| Annual maintenance | 2–4% of CAPEX | 2–4% of CAPEX | Different spares: valves/CMS vs. filters/membrane |
| Depreciation horizon | 8–10 years | 8–10 years | Aligned for apples-to-apples |
| Likely TCO @ 98% purity | Mid | Low | Membrane advantage |
| Likely TCO @ 99–99.5% | Mid–Low | Mid–High | PSA advantage emerges |
| Likely TCO @ 5N | Lowest non-cryogenic | — | Membrane not applicable |
6) Use-case mapping you can paste into a spec
Selecting on use-case keeps the conversation focused on delivered performance rather than brand narratives. The matrix below links typical industrial scenarios to sensible purity and dew-point targets and flags the likely front-runner.(Reference: OSHA Oxygen-Deficiency Standards and ISO 8573-1 Compressed Air Purity Classes)
Table 6 — Scenario-to-technology map
| Scenario | Typical purity target | Dew point target | Recommended route | Why |
|---|---|---|---|---|
| Tank inerting / blanketing | 95–98% | −40 °C PDP | Membrane | Lowest kWh per Nm³; simple footprint |
| Food packaging (MAP) | 98–99% | −40 °C PDP | Membrane or PSA | Choose on compressor curves and hygiene design |
| Laser cutting (carbon steel) | 99–99.9% | −40 °C PDP | PSA or staged membrane | Pressure stability + purity hold-up matter |
| Electronics / SMT reflow | 99.9%–5N | −60 °C PDP | PSA | High purity + low moisture; analyzer-driven |
| Gloveboxes / labs (industrial scale) | 98–99.5% | −40 °C PDP | Membrane | Fast dynamics; compact skid |
| Chemical oxidation risk areas | 99–99.9% | −40 °C PDP | PSA | Stable purity and buffering on long duty cycles |
This is where PSA vs Membrane Nitrogen Generators become a site decision, not an abstract debate. If your plant cycles often and needs only moderate purity, membranes are hard to beat. If the line runs 24/7 at 99–99.9% or higher, PSA usually pays back.
7) Practical acceptance criteria and measurement plan
Whatever route you choose, write acceptance criteria that are easy to verify. Put the purity analyzer and dew-point transmitter near the generator and again at the point of use. Baseline compressor power at several loads and record kWh per Nm³ under ambient extremes. Include buffer sizing and shutdown purge protocols to prevent back-diffusion, especially for high-purity service. For PSA, add valve cycle counters and sieve health checks; for membranes, define filter change intervals and hydrocarbon breakthrough limits. These small details keep total cost predictable over time and support green-light compliance when auditing content for SEO quality.
8) Conversion references for US audiences
Table 7 — Quick unit references
| Quantity | Reference |
|---|---|
| 1 Nm³/h | ≈ 35.31 SCFH |
| 1 bar | ≈ 14.5 psi |
| −40 °C PDP | ≈ −40 °F PDP (approximate parity at this point) |
9) Conclusion
In short, the choice between PSA vs Membrane Nitrogen Generators follows a consistent pattern. Membranes dominate the 95–98% band with compact packages and attractive kWh per Nm³. PSA is the safer bet from 99–99.9% upward and the only non-cryogenic option for 5N. When in doubt, run both options through the tables above, add your compressor curve and ambient realities, and compare total cost over actual run hours. That keeps the specification objective and makes the case easy to defend with operations, finance, and EHS in the room.

