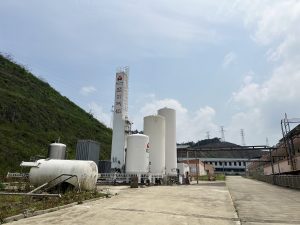
Engineers rely on air separation units (ASUs) to deliver high-purity oxygen, nitrogen, and often argon at industrial scale. This article walks through the cryogenic air separation process from compression to distillation, explains the roles of major equipment, and summarizes efficiency levers that matter in design and operation. The focus is practical: if you build, specify, or operate ASUs, you should find enough detail here to benchmark performance and guide optimization.This overview centers on cryogenic air separation in modern ASUs.
Why cryogenic instead of non-cryogenic?
PSA/VSA and membrane systems dominate small and medium nitrogen demands, but when the duty calls for large oxygen flows (e.g., >300 tpd) or very high nitrogen purities (5N), cryogenic air separation is the robust, economical choice. It supports multiple products (O₂/N₂/Ar in gas or liquid form), offers tight control of purity and pressure, and integrates well with downstream users such as steel, chemicals, glass, and electronics.
Cryogenic Air Separation Process: From Ambient Air to High-Purity Gases
- Intake & filtration. Ambient air passes through coarse and fine filters to remove particulates.
- Compression. A multi-stage centrifugal or integrally geared compressor raises air pressure (typically 5–7 bar) with intercooling.
- Pre-cooling. Chillers or cooling water reduce air temperature to protect the adsorbents and improve heat-exchange efficiency.
- Purification. A dual-bed molecular sieve system removes H₂O, CO₂, and most hydrocarbons to prevent freeze-out in the cold box. Beds alternate between adsorption and heated or vacuum-assisted regeneration.
- Main heat exchanger (MHE). Clean, dry air exchanges heat with cold product and waste streams, approaching within a few kelvin at the cold end.
- Cold production. Expansion turbines (and, where used, Joule–Thomson valves) generate refrigeration to reach cryogenic temperatures.
- Rectification. In a double-column system, the high-pressure (HP) column (~5–6 bar) partially condenses feed air; the low-pressure (LP) column (~1.2–1.4 bar) completes the separation, producing oxygen-rich liquid at the bottom and nitrogen-rich vapor at the top. Reboil/condensation coupling between columns closes the energy loop.
- Argon section (optional). A side draw near the O₂/Ar azeotrope feeds a crude-argon and then a pure-argon column to recover high-purity argon.
- Warming, compression, and storage. Products are rewarmed in the MHE, compressed if gaseous delivery pressures are required, and routed to pipelines or liquefied and sent to tanks.
This double-column rectification with tight heat integration is the core of cryogenic air separation, enabling efficient, continuous production.
Major equipment and what “good” looks like
- Air compressor & drives. Specific power is sensitive to compressor isentropic efficiency and inlet conditions. Variable inlet guide vanes and proper anti-surge control preserve part-load efficiency.
- Molecular sieve purifier. Bed sizing and cycle timing determine pressure drop and breakthrough margins; a well-tuned unit avoids CO₂ slip that could freeze in the MHE.
- Plate-fin MHE. Aluminum brazed exchangers offer high surface area; design targets a 2–3 K cold-end approach while respecting hydrocarbon dew-point safety margins.
- Turboexpander. The expander’s enthalpy drop supplies most of the refrigeration. Shaft power recovery (to a helper compressor or generator) improves net efficiency.
- Distillation columns. Efficient structured packing or trays, plus stable reflux, are essential for sharp splits. Typical HP/LP pressures are ~5–6 bar and ~1.2–1.4 bar respectively.
- Cryogenic valves & instrumentation. Tight shutoff and dependable positioners are crucial for column balance and start-up reproducibility.
- Product compressors & liquefiers. For gaseous delivery, O₂ or N₂ compressors set the final pressure. For liquid, subcoolers and storage tanks introduce their own optimization space.
Oxygen and nitrogen product qualities
- Oxygen: large industrial ASUs commonly deliver 95–99.6% purity gaseous oxygen; 99.5%+ is standard for many applications. Delivery pressure ranges from near-atmospheric (to downstream compressors or pipelines) to several bar for on-site users.
- Nitrogen: gaseous nitrogen can be tuned from 99.9% up to 99.999%+ depending on reflux and draw location; higher purity reduces available flow and raises power slightly. Liquid nitrogen purity typically meets 10–20 ppm O₂ specs for electronics and other sensitive users.
- Moisture & CO₂: effectively at trace-ppm levels thanks to upstream purification and cold-box scrubbing effects.
Because the cryogenic air separation process is highly coupled, changing one product’s purity or pressure will affect the others. Experienced operators use constraints (compressor head, cold-end approach, tray loading) to decide where to compromise.
Energy and Efficiency in Cryogenic Air Separation
Energy use in cryogenic air separation is driven by the air path, cold-box thermodynamics, and the required product conditions.
Three levers dominate specific energy:
- Air path efficiency. Compressor isentropic efficiency, intercooler approach, and inlet air temperature materially change kWh/ton O₂.
- Cold-box thermodynamics. Cold-end approach in the MHE, expander isentropic efficiency, and column pressure ratio set the refrigeration duty.
- Product slate & conditions. More liquid product (LIN/LOX/LAR) and higher delivery pressures both increase power. Ultra-high-purity nitrogen and deep argon recovery also add duty.
Modern large ASUs typically land in the low- to mid-200s kWh per metric ton of gaseous O₂ (at modest delivery pressure). Smaller units trend higher due to scale effects and lower component efficiencies.
Argon: when it’s worth recovering
Air contains ~0.93% argon. If there’s a nearby market or internal use, a dedicated argon section (crude-argon plus pure-argon column) can recover a significant fraction of that content. Recovery of 80–90% of in-feed argon is realistic in well-designed units, though this adds column duty and condenser load. Where markets are thin, many plants bypass argon recovery to minimize complexity and power.
Control and Safety in Cryogenic Air Separation
- Control. Stable O₂/N₂/Ar balances come from maintaining column pressures, reflux flows, and MHE temperature profiles. Advanced control (MPC) can reduce drift and improve energy efficiency during load swings.
- Safety. Hydrocarbon management (both feed monitoring and adsorber health) is non-negotiable. Oxygen-service materials, velocity limits in oxygen piping, and proper relief/vent systems protect equipment and personnel.
- Start-up & upset recovery. Standardized sequences shorten cold-down time and protect the MHE. Instrument redundancy (temperatures, pressures, analyzers) helps operators diagnose maldistribution or incipient freeze-out before it becomes a trip.
Design and scaling notes engineers care about
- HP/LP pressure selection trades compressor power against column separation efficiency; too low a ΔP reduces reboiler duty, too high wastes compressor work.
- MHE pinch has hard lower bounds due to exchanger effectiveness and safety margins for hydrocarbon dew points; pushing below ~2 K invites fouling risk.
- Expander integration (power recovery vs. dedicated refrigeration) depends on site utilities and turndown expectations.
- Liquid versatility. Designing for liquid co-production increases market flexibility but requires extra refrigeration and storage investment.
- Maintenance strategy. Valves, analyzers, and sieve beds are the usual bottlenecks; planned outages aligned with sieve changeouts and valve overhauls minimize lifetime cost.
Typical design and performance ranges
Use this table as an engineering checkpoint when reviewing specs or vendor proposals. Values reflect commonly reported ranges for modern plants; site conditions and product slates will shift the exact numbers.
Table 1. Typical design and performance ranges in cryogenic air separation.
| Item | Typical Range | Engineering Notes |
|---|---|---|
| Feed air pressure to cold box | 5.0–6.5 bar(a) | Balance compressor power vs. column driving force |
| LP column pressure | 1.15–1.40 bar(a) | Lower pressure improves relative volatility but reduces temperature lift |
| Cold-end approach (MHE) | 2–3 K | Tighter pinch saves power but raises freeze-out risk |
| Turboexpander isentropic efficiency | 75–85% | Directly reduces refrigeration power |
| Gaseous O₂ purity | 95–99.6% | 99.5%+ common; higher purity increases reflux duty |
| Gaseous N₂ purity | 99.9%–99.999%+ | Ultra-high purity lowers N₂ yield and raises power slightly |
| Specific power (GOX, modest pressure) | ~200–300 kWh/ton O₂ | Large units near lower end; small plants higher |
| Argon recovery (with argon section) | 80–90% of in-feed Ar | Adds column duty; evaluate market value |
| Typical dew points (dry products) | ≤ –60 °C | Set by purifier performance and cold-box scrubbing |
| Liquid share of total products | 0–40% | Higher liquid share → higher power and refrigeration |
Practical optimization checklist
- Measure what matters. Track MHE temperature profiles, column differential pressures, and expander performance, not just product purity.
- Tune purifier cycles. Regenerate hot enough and long enough to prevent CO₂ slip; verify valve seating to avoid bed bypass.
- Manage oxygen velocities. Keep within recommended limits to cut ignition risk in enriched streams.
- Right-size analyzers. Fast, reliable O₂/N₂/Ar analyzers close the loop on purity without excessive sampling lags.
- Plan for turndown. If the host plant swings load, specify guide-vane control, variable-speed drives where justified, and robust column controls that hold split integrity across rates.
- Review argon economics. Install argon recovery only if price/volume supports the additional duty and maintenance.
Conclusion
The cryogenic air separation process remains the most flexible and efficient route to large-scale industrial gases. When an ASU’s compressor path, cold-box thermodynamics, and column internals are tuned as a system, plants reliably deliver oxygen and nitrogen at the required purity, pressure, and cost. For engineering teams, the payoffs are tangible: better specific power, shorter start-ups, steadier purities, and safer operation. If you’re benchmarking a design or diagnosing under-performance, start with the heat-balance sheet, the MHE pinch, and the column pressure ratio—then work outward to argon handling and product conditions. In most cases, that’s where the biggest, fastest wins hide.